The summer of 2015 brought historically hot and dry conditions to the Inland Northwest. Record low rainfall and record high heat, combined with very low snowpack, caused record low flows on the Spokane River. We knew little about what these conditions would have on water temperatures in the Spokane River, so we placed continuous water temperature loggers in a few areas of the river. Due to the complex interaction between the Spokane-Rathdrum Prairie Aquifer and the Spokane River, we expected to see a wide range of water temperatures. What we found were water temperatures that reflected the complex interaction with our aquifer, upriver temperatures that were too hot for our native Redband Trout, and data that led to many more questions. First, a bit of Spokane River hydrology.
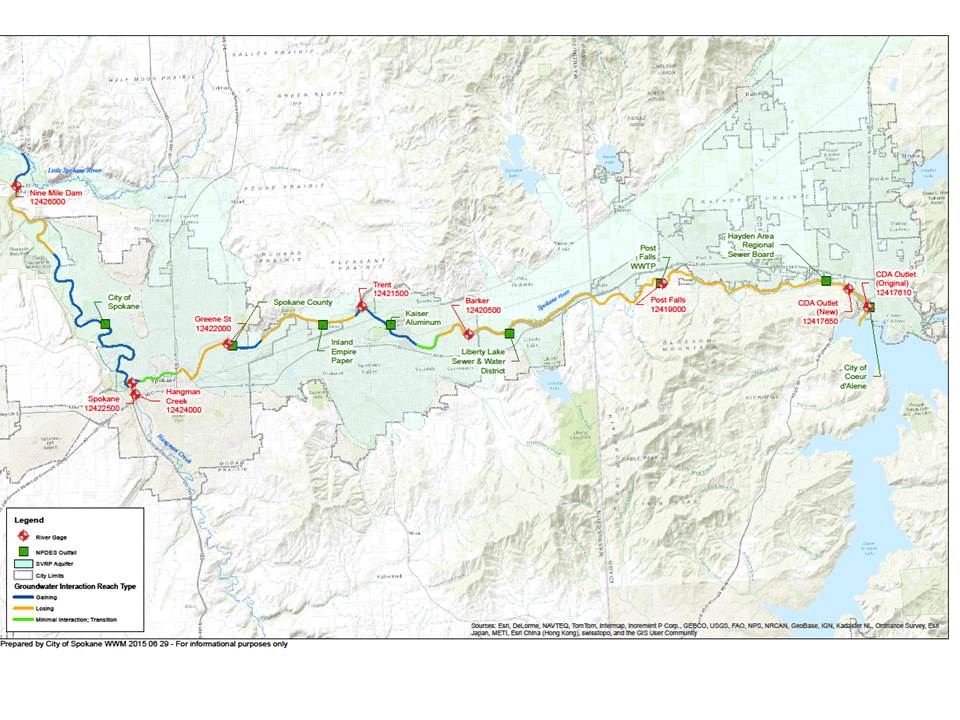
The Spokane River flows out of Lake Coeur d'Alene and over the Post Falls Dam. The water in this "losing reach" of the Spokane River between Lake Coeur d'Alene and Sullivan Road is slowly seeping into the ground, replenishing our groundwater. Water temperature in this stretch of the river should be similar to the water temperature at the surface of Lake Coeur d'Alene, plus any warming that occurred in the river. Ground water also feeds the Spokane River. The Spokane-Rathdrum Prairie Aquifer, provides cool groundwater to the "gaining reaches" of the Spokane River (see map below), which come in mostly below Sullivan Road. Water temperatures in and downriver of these gaining reaches should be much cooler than the upriver section of river, depending on the proportion of cool aquifer water in the river.
In late June we saw dead fish and measured very warm temperatures in the Spokane River near Barker Road. This prompted us to place temperature loggers at five locations along the Spokane River in early July. Two at losing reaches in the upriver section at Harvard Road and Barker Road and three at gaining reaches at Islands Trailhead, Water Street (downstream from downtown), and TJ Meenach Bridge (see map below). 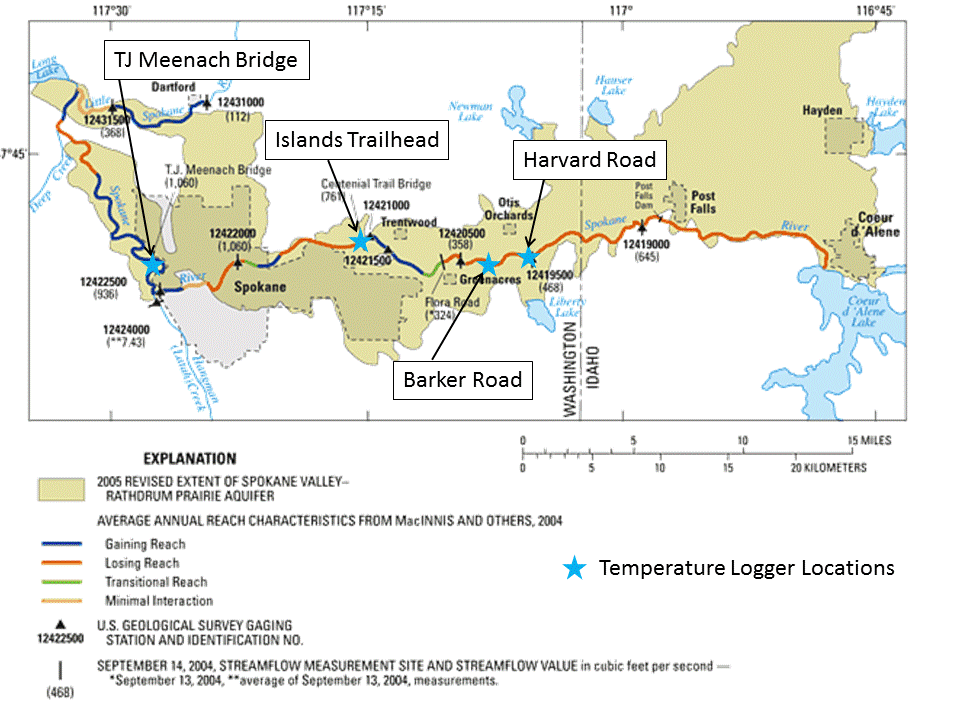 Our method was simple, we placed Hobo Tidbits temperature data loggers which we set to record water temperature every 30 minutes in a short PVC tube for shade. They were then placed in the river at a depth of about two feet. The logger placed at Water Street was stolen, but the other loggers recorded temperature data from 7/16/15 to 8/20/15.
Water temperatures in the Spokane River varied dramatically between some locations. The average temperature at Harvard and Barker Road was 23.6 and 23.5 C, respectively, while the temperature downriver at Islands Trailhead and TJ Meenach Bridge was 13.6 and 15.1 C, respectively. This is a difference of over 8.5 C (15 F). This difference shows the influence of the aquifer on the down and upriver sections of river.
| Data Summary of Spokane River Temperature Gages (summary courtesy of Allan Scholz of EWU) |
| Location |
Dates (inclusive) |
Average temp (C) |
Range of daily average temp (C) |
| Islands Trailhead |
July 16 – August 20 |
13.6 |
12.7 (on 8/20) – 15.9 (on 7/20) |
| Harvard Rd |
July 16 – August 20 |
23.6 |
22.3 (on 7/27) – 24.7(on 8/13) |
| TJ Meenach |
July 16 – August 20 |
15.1 |
14.2 (on 8/20) – 17.1 (on 8/12) |
| Barker Rd |
July 16 – August 20 |
23.5 |
21.7 (on 7/26) – 25.5 (on 7/20) |
Looking at the data graphically, it gets a bit more interesting (see graph below). The upstream loggers at Harvard and Barker Road showed very similar patterns. Comparing the upstream loggers to the minimum and maximum air temperatures in Spokane (data courtesy of NWS Spokane), shows that warmer air temperatures translate into warmer water temperatures (no surprise there). Differences between daily maximum and minimum water temperatures at the upriver loggers were about 5 C, and varied between about 20 C and 27 C.
The two loggers influenced by the aquifer, at Island Trailhead and TJ Meenach Bridge, showed much cooler temperatures, small temperature variation, and seemed to be influenced less by air temperature than by other factors. Temperatures at these locations varied by about 2 C daily, between approximately 12 and 17 C degrees at Island Trailhead and 14 and 17 C degrees at TJ Meenach Bridge. Although daily air temperatures do seem to affect water temperatures at these locations, another factor may have an even larger affect.
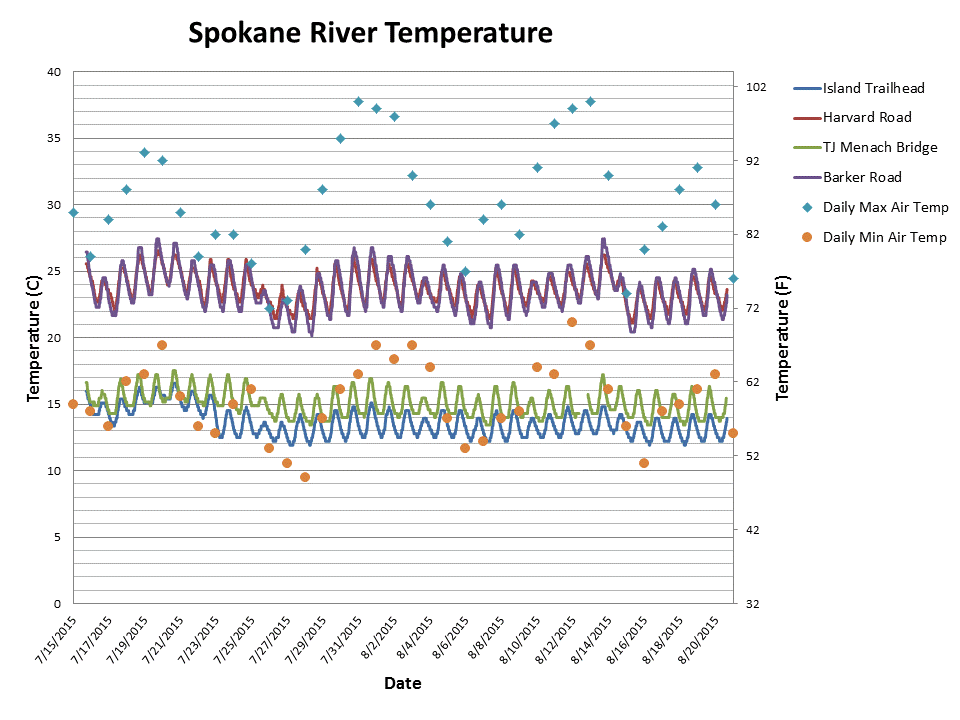 After 7/23/15 water temperatures at Island Trailhead become much colder than that at TJ Meenach Bridge, having remained similar for the previous week. This divergence in water temperature correlated with the reduction in flow out of the Post Falls Dam (see flow graph below) from 640 cubic feet/second (cfs) to 500 cfs. The drop in water temperature at Islands Trailhead could be due to the reduction of warm water flowing over the dam and into the river, increasing the proportion of the cool aquifer water in the river at Islands Trailhead. Although this explains the drop in temperature at Islands Trailhead, it does not explain the divergence of water temperatures between Islands Trailhead and TJ Meenach Bridge. More data will be required to explain why temperature at TJ Meenach remains more or less constant, while flow seems to affect water temperature at Islands Trailhead.

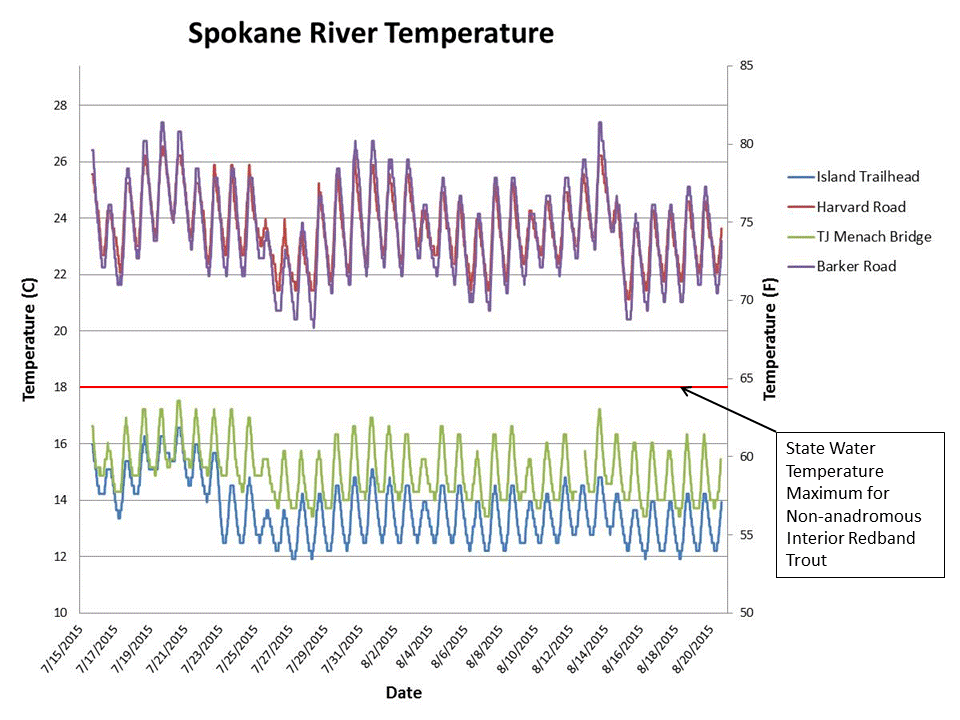
Water temperatures in our river affect our native Redband Trout, a fish that needs cool, clean water to survive. Water temperatures seen this summer in the upper river are much too high for trout (see graph below). In fact, trout numbers in this stretch of the river are dropping. Although competition and predation from other fish likely play a role, during some summers water temperatures are much too hot for trout in this section of river.
Next summer the Spokane Riverkeeper hopes to expand this study. If we can find funding to purchase more temperature data loggers, we can monitor more sections of the Spokane River, including tributaries. Our studies will provide long term data in a river system that has complex temperature dynamics, that as far as we know, is not being taken by any one else.
 The Spokane Riverkeeper is thrilled to announce that the 2015 Mike Chappell River Hero Award goes to Andy Dunau. Although we don't have strict criteria for selecting who receives the River Hero Award, we all agree that it is given to someone whose work helps preserve and protect the Spokane River. There is no doubt that Andy's work does just this, but before I explain further, I wanted to give a bit of history.
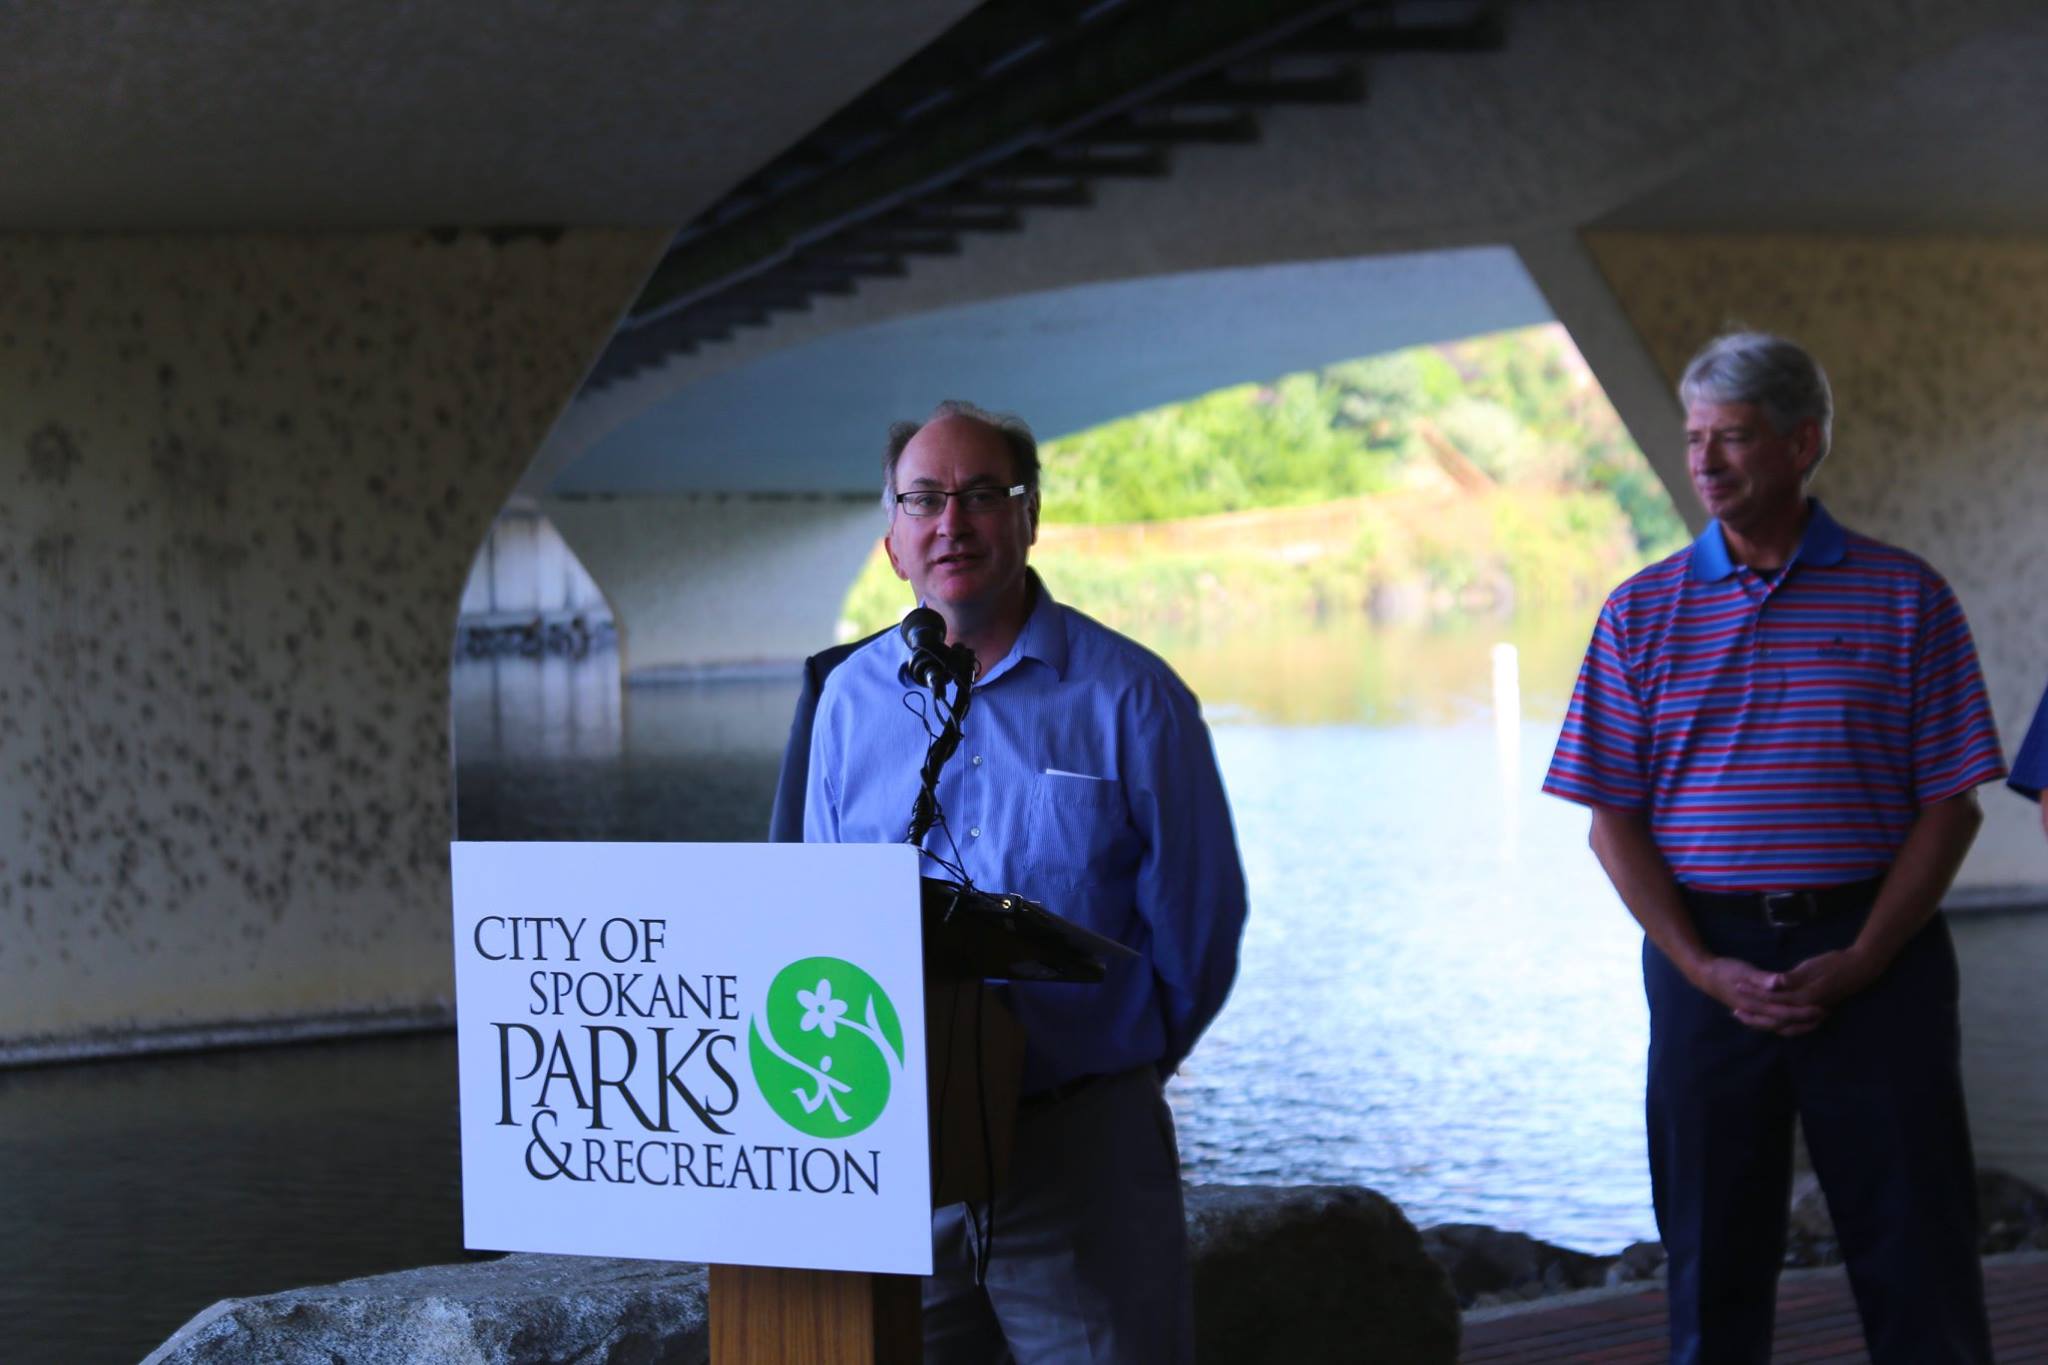 Andy's love of the river started with an opportunity to create the Spokane River Forum. His work heading the Spokane River Forum led him to understand that experiences on the river them lead people to love it. The Spokane River Forum acts as an information clearinghouse, distributing important technical documents, river news, and most importantly, the Spokane Water Trail. Essentially a "one stop shop" for all things Spokane River, the Spokane Water Trail is an online resource that provides recreationalists information on boat launches and facilities along the Spokane River. Andy doesn't just sit behind a computer. Since 2008 he has paddled the entire Spokane River and connected over 700 people to the River through river floats. He realizes he cannot do it all though and has worked behind the scenes to provide more access to the river, such as under the Division Street Bridge (see photo above).


 After 7/23/15 water temperatures at Island Trailhead become much colder than that at TJ Meenach Bridge, having remained similar for the previous week. This divergence in water temperature correlated with the reduction in flow out of the Post Falls Dam (see flow graph below) from 640 cubic feet/second (cfs) to 500 cfs. The drop in water temperature at Islands Trailhead could be due to the reduction of warm water flowing over the dam and into the river, increasing the proportion of the cool aquifer water in the river at Islands Trailhead. Although this explains the drop in temperature at Islands Trailhead, it does not explain the divergence of water temperatures between Islands Trailhead and TJ Meenach Bridge. More data will be required to explain why temperature at TJ Meenach remains more or less constant, while flow seems to affect water temperature at Islands Trailhead.






 However, cleaning up nonpoint source pollution falls to a variety of organizations which employ a variety of methods. The Washington State Department of Ecology (Ecology) is tasked with enforcing the environmental regulations in Washington State. Recently, we wrote a letter to Ecology, supporting the work they do. In short we said....

 This year's snowpack is the


